SPgS.eSecure365 can be seamlessly integrated with modern reporting tools such as Power BI, Tableau, and similar platforms to transform raw operational data into actionable insights. The system’s AI and computer vision modules generate structured data streams from multiple outlets, including compliance checks, customer behavior, safety alerts, and IoT device interactions. By connecting these data streams to reporting tools through APIs, data connectors, or cloud-based integration layers, businesses can establish real-time dashboards that unify performance metrics across all locations.
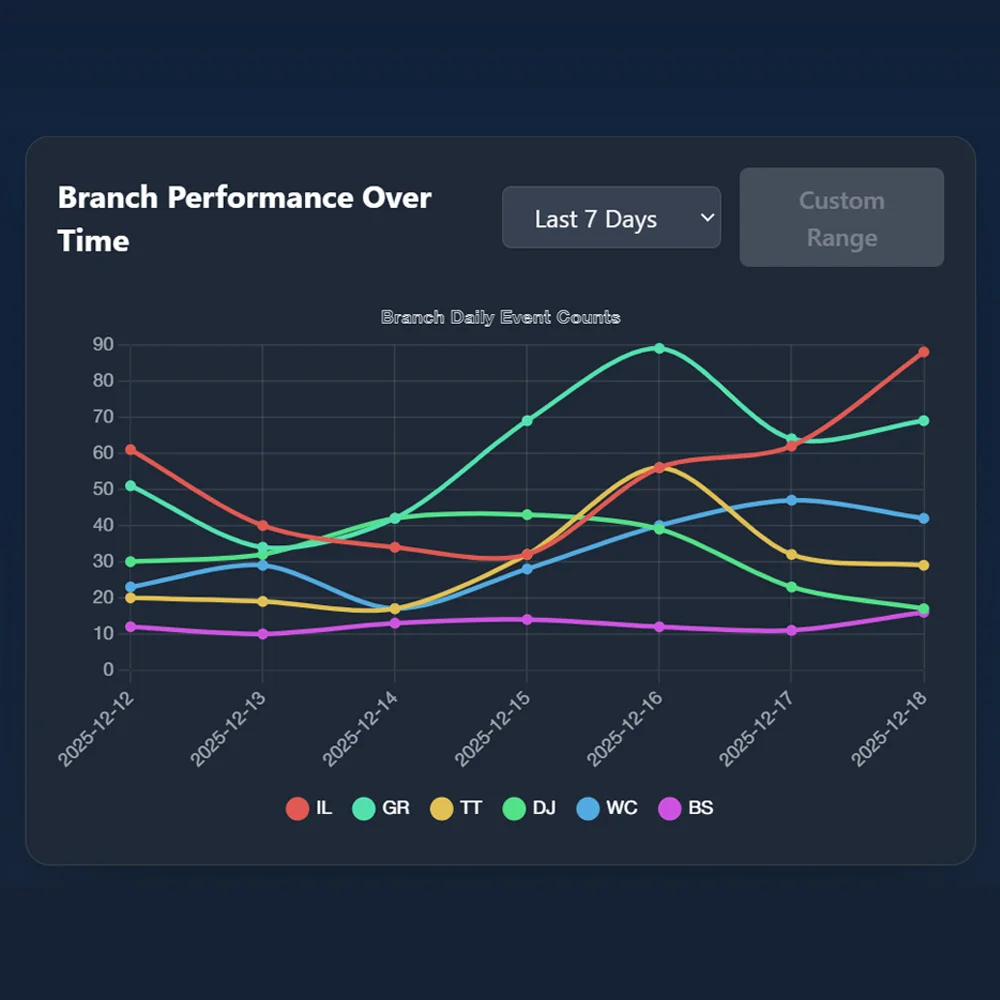
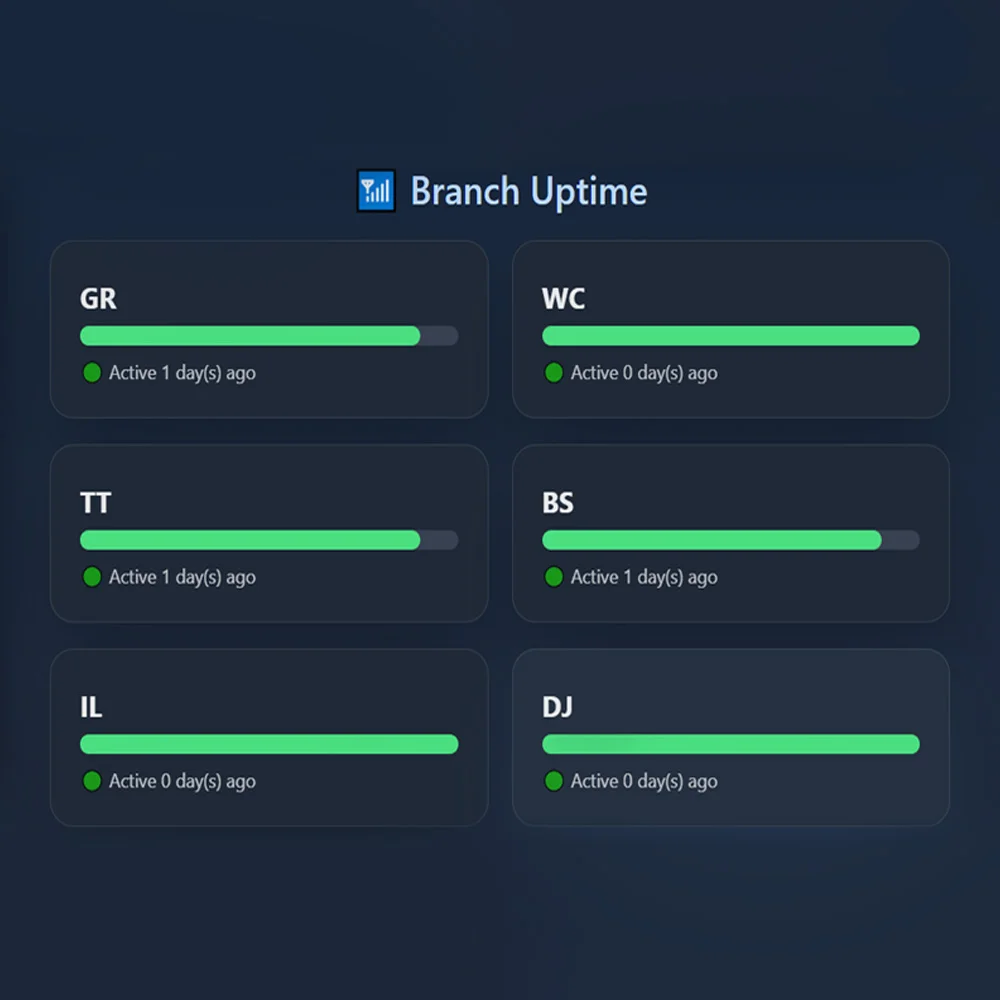
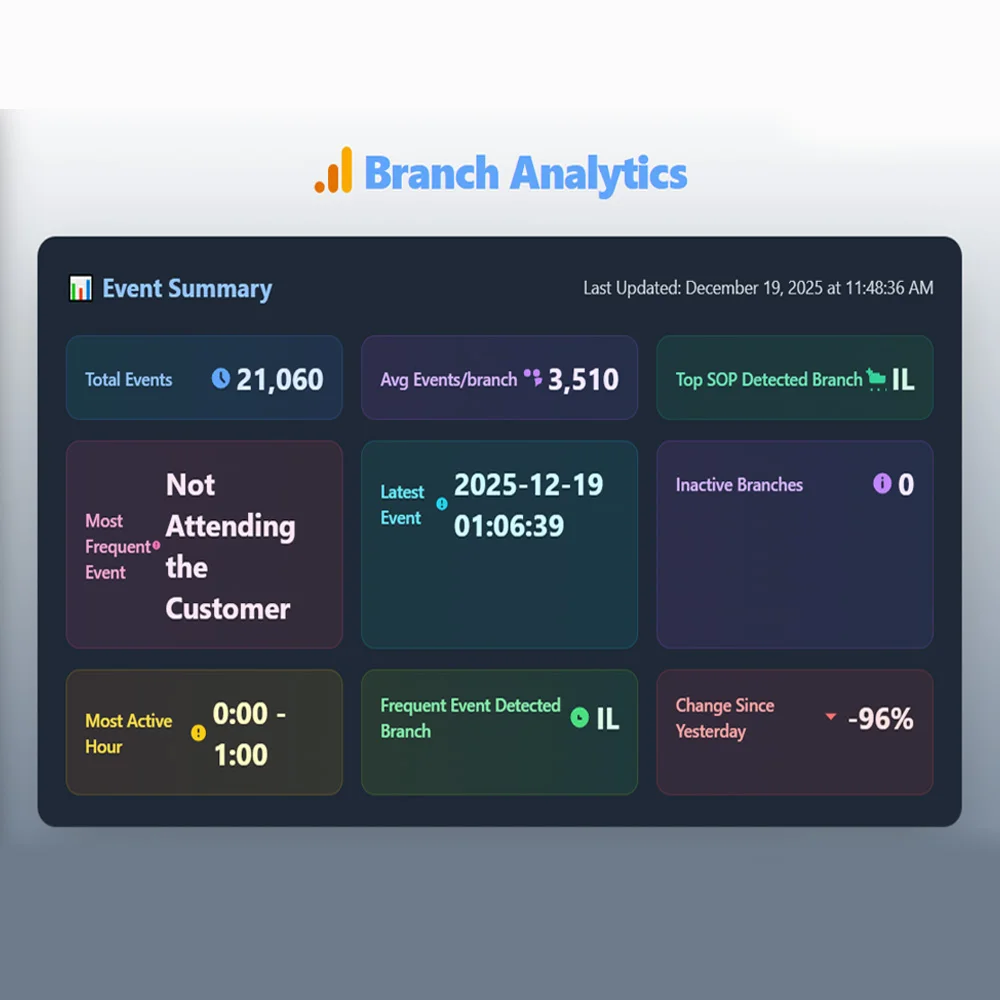
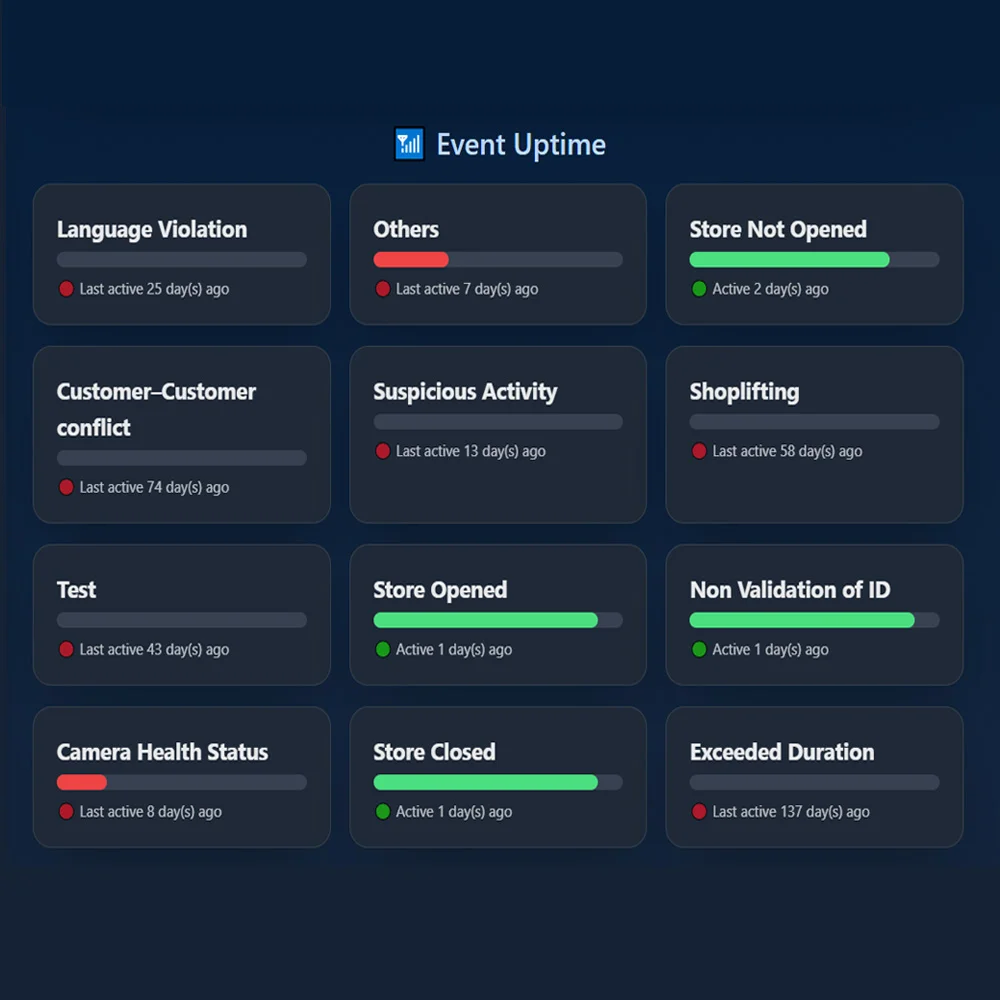
Power BI and Tableau allow the creation of interactive visualizations that highlight key performance indicators (KPIs). For example, managers can view compliance status by outlet, analyze incident trends, or monitor corrective and preventive actions (CAPA) effectiveness. Reports can also track workforce productivity, queue management, energy consumption from IoT sensors, and customer engagement patterns. Predictive analytics can be layered on top, enabling forecasting of potential risks or operational bottlenecks.