Introduction: If You Can’t Measure It, You Won’t Invest in It
AI video analytics sounds powerful:
- Real-time alerts
- Theft detection
- SOP enforcement
- Multi-location visibility
But every decision-maker ultimately asks:
👉 “What’s the ROI?”
Because no matter how advanced the solution is—
if it doesn’t generate measurable financial returns, it won’t get approved.
The reality?
👉 AI video analytics delivers one of the fastest and most measurable ROIs in operations.
Let’s break it down with a practical example.
⚠️ The Problem: Hidden Losses You’re Not Tracking
Across retail, warehouses, QSR, and pharma operations, businesses face:
💰 Common Loss Areas
- Inventory shrinkage / theft
- SOP violations
- Billing errors
- Product damage
- Idle workforce
- Compliance failures
Most of these losses are:
👉 Invisible in reports—but directly impacting your margins.
📊 Step 1: Identify Your Current Losses
Let’s consider a mid-sized retail chain:
Scenario:
- 20 stores
- Average daily revenue per store: $1,200
📉 Hidden Loss Estimates:
1. Theft / Shrinkage (~1%)
👉 $1,200 × 1% = $12/day/store
👉 $12 × 20 × 365
👉 $87,600 annually
2. SOP Violations & Billing Errors (~0.5%)
👉 $43,800 annually
3. Operational Inefficiencies
- Idle staff
- Poor service
- Missed sales
👉 Estimated: $25,000 annually
💥 Total Estimated Loss:
👉 $150,000 – $160,000 per year
And in most businesses, this is never fully measured.
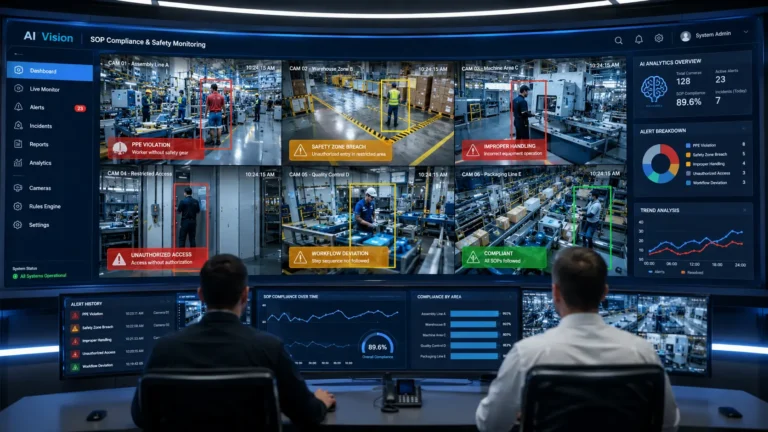
🤖 Step 2: What AI Video Analytics Fixes
AI platforms like CAPASai directly target these loss areas:
🔍 Key Capabilities:
- Real-time theft detection
- SOP compliance monitoring
- Staff activity tracking
- Customer service optimization
- Instant alerts with video evidence
👉 Instead of reacting to problems, you prevent them.
📈 Step 3: Estimate Loss Reduction
Conservative improvements:
- Theft reduction → 30–50%
- SOP violations → 40–60%
- Efficiency gains → 20–30%
📊 Revised Savings:
1. Theft Reduction (40%)
👉 $87,600 × 40%
👉 $35,040 saved
2. SOP Violation Reduction (50%)
👉 $43,800 × 50%
👉 $21,900 saved
3. Efficiency Gains (25%)
👉 $25,000 × 25%
👉 $6,250 saved
💰 Total Annual Savings:
👉 $63,190
💸 Step 4: Cost of AI Video Analytics
Assuming a typical pricing model:
- $35 per camera/month
- 5 cameras per store
- 20 stores
📊 Annual Cost:
👉 $35 × 5 × 20 × 12
👉 $42,000 per year
🧮 Step 5: Final ROI Calculation
📈 Net Gain:
👉 Savings: $63,190
👉 Cost: $42,000
👉 Net Profit: $21,190
📊 ROI Formula:
ROI=NetGainInvestment×100ROI = \frac{Net Gain}{Investment} × 100ROI=InvestmentNetGain×100
👉 ROI = ($21,190 / $42,000) × 100
👉 ~50% ROI in Year 1
⚡ The Real Insight
This is a conservative estimate.
In real-world deployments:
- ROI often ranges from 70% to 150%
- Payback happens within 6–9 months
- High-risk environments see even faster returns
👉 The bigger your operation, the higher the ROI.
🔥 ROI Beyond Numbers (Critical for Decision-Makers)
🧠 Better Decision-Making
Real-time insights replace assumptions.
👷 Improved Workforce Discipline
Employees perform better with accountability.
⭐ Consistent Customer Experience
Standardized SOP execution across locations.
🛡️ Reduced Risk Exposure
Fewer compliance issues and operational failures.
📊 Audit-Ready Operations
Every incident backed by video evidence.
🏭 ROI Across Industries
🛒 Retail
- Reduced shrinkage
- Better billing control
📦 Warehousing & Logistics
- Lower damage and theft
- Improved safety
🍔 QSR Chains
- Faster service
- SOP consistency across outlets
💊 Pharma Manufacturing
- Compliance monitoring
- Reduced batch failures
⏳ Payback Period
One of the biggest advantages:
👉 Fast ROI realization
Typical payback period:
- 6–12 months
- Often faster in high-loss environments
📊 Before vs After ROI Mindset
Before AI | After CAPASai |
Viewed as cost | Viewed as profit recovery |
Losses untracked | Losses measured |
Reactive management | Proactive control |
Limited visibility | Real-time insights |
🧠 Why Businesses Miss This Opportunity
Because:
- Losses are hidden
- Data is fragmented
- No real-time monitoring
👉 So the ROI potential remains invisible.
🔮 The Future: AI as a Profit Protection Layer
AI video analytics is evolving into:
👉 A core operational layer—not just a security tool
Businesses adopting early:
- Gain margin advantage
- Improve scalability
- Reduce operational risks
⚡ Final Thought
AI video analytics is not an expense.
👉 It’s a profit protection engine.
If you’re not actively measuring:
- Shrinkage
- SOP violations
- Operational inefficiencies
👉 You’re leaving money on the table.
🎯 Call to Action
Want a customized ROI calculation for your business?
👉 Book a live demo of CAPASai
👉 Get a tailored savings estimate
👉 Identify hidden losses across your operations
It’s not always visible.
It’s not always reported accurately.